Table of Contents
Introduction#
Welcome to my take on the Cloud Resume Challenge! The Cloud Resume Challenge is a resume project designed to build and demonstrate skills relevant to a career in the cloud. In addition to acting as a resume site, my take on the challenge demonstrates:
- Infrastructure managed with
TerraformandAnsible - A Python web application utilizing
Flask,Gunicorn, andGoogle Firestore. - Traffic routed through
Cloudflarefor DDoS protection, performance caching, andWeb Application Firewall (WAF)rules. - Fully automated TLS between the site and Cloudflare using
CaddyandLet's Encrypt - Front-to-Back monitoring implemented with
Datadog - CI/CD handled by
GitHub Actions
This project highlights my ability to design, build, automate, operate, and troubleshoot a live application while making practical engineering tradeoffs around simplicity, reliability, security, cost, and maintainability.
System Overview#
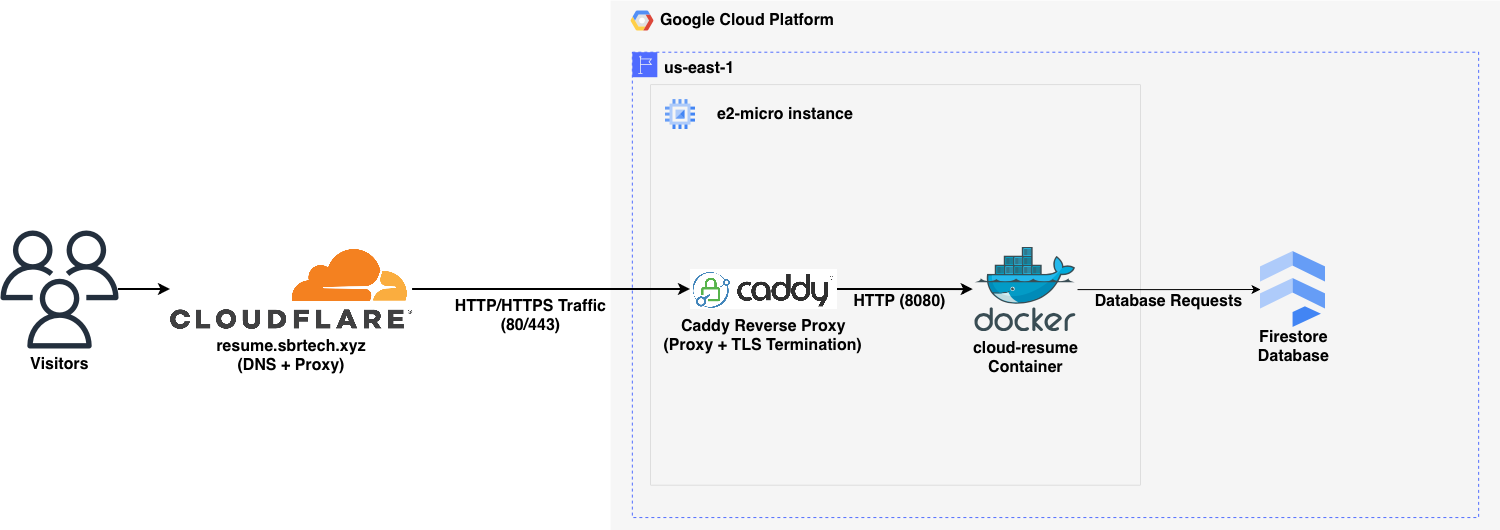
The infrastructure stack is relatively straightforward.
- Infrastructure is provisioned in GCP and Cloudflare using Terraform.
- Ansible configures the GCP instance and deploys the site as a Docker container.
- Public traffic enters through Cloudflare.
- Caddy performs reverse proxying and TLS termination on traffic from Cloudflare.
- Flask/Gunicorn serves the site's content.
- Google Firestore stores the visitor counter widget data.
- Datadog collects metrics, logs, and app traces.
Architecture Diagram#
Key Engineering Decisions#
1. Cloudflare Proxy in Front of a Caddy Reverse Proxy#
This project places Cloudflare in front of a Caddy reverse proxy instead of exposing the application container directly to the internet.
That approach solves several problems at once without adding much complexity. Cloudflare provides a security and performance layer at the edge, while Caddy offers a simple way to handle reverse proxying and TLS on the server itself.
On the Cloudflare side, using proxied DNS helps reduce direct exposure of the origin server and adds useful protections like DDoS mitigation and edge filtering before traffic ever reaches the GCP instance. It also helps reduce load on the origin by serving cached content closer to the visitor, which is especially valuable when the backend is running on a small e2-micro instance. To make sure traffic actually flows through Cloudflare and not around it, the design is enforced with Google Compute Firewall rules that only allow inbound HTTP and HTTPS traffic from Cloudflare IP ranges.
On the server side, Caddy sits in front of the application container and handles TLS termination automatically with Let's Encrypt. Because the site is behind Cloudflare proxy, Caddy uses the DNS challenge through Cloudflare to validate domain ownership and issue certificates. This keeps traffic encrypted from the visitor to Cloudflare and from Cloudflare to the server, with plaintext only existing locally when Caddy forwards requests to the container on the same host.
Caddy also provides a clean place to rewrite the X-Forwarded-For header using Cloudflare's CF-Connecting-IP header. That allows the application to see the visitor's real client IP for logging and visitor counting without needing more application-side logic.
The result is better performance, lower origin exposure, simpler TLS management, and accurate client IP preservation without adding much operational complexity.
2. 24-Hour IP Caching to Reduce Firestore Reads and Preserve Free Tier Limits#
This project caches visitor IPs and the current counter value in memory instead of reading from and writing to Firestore on every page load.
That approach is a better fit for Firestore's free tier, which has daily limits on reads, writes, and deletes. If every refresh triggered multiple database operations, the visitor counter would be much more expensive to run and far easier to abuse. Since this project only needs to count meaningful visits, not every single refresh from the same person, a short-lived in-memory cache makes much more sense.
The application stores each client IP with a timestamp and treats that entry as valid for 24 hours. If that same visitor comes back again within that window, the app does not need to check Firestore again for that IP, and the counter does not increment. The current counter value is also cached in memory so the app does not need to re-read it from Firestore on every request. In practice, this means Firestore is mainly used on cache misses, after application restarts, and when cached visitor data has expired and the stored value actually needs to change.
The result is lower database usage, better preservation of the Firestore free tier, and a visitor counter that is more resistant to noisy repeat traffic. The tradeoff is that the cache is in memory, so it is lost on application restart and would not scale cleanly across multiple app instances. For a single small service, though, that tradeoff is worth it.
3. Datadog-Ready Structured JSON Logging#
This project emits structured JSON logs instead of traditional plain text application logs.
That approach makes the system observable from the start rather than treating observability as an afterthought. Datadog can ingest JSON logs directly, which makes the fields much easier to search and work with than if everything were buried inside a raw log line. The log structure is also matched to Datadog's standard attribute names where it makes sense, so fields like client IP, HTTP status code, request path, request time, and user agent are immediately useful for filtering, dashboards, and alerting.
Structured logging also keeps logs and tracing working together cleanly. By keeping logs in JSON format, ddtrace can inject correlation data into the logs so traces and requests can be tied back to one another more easily. That makes it much simpler to move from "something looks wrong" to the specific request or trace that caused it.
The result is less time spent normalizing logs after the fact and more time spent on the parts of observability that actually matter operationally, like dashboards, monitors, and synthetic checks.
4. IAM-Based Firestore Access#
This project uses IAM-based access for Firestore instead of storing and distributing a database credential inside the application.
That is a better fit for a workload already running on GCP. Rather than introducing another secret to generate, store, rotate, and protect, the platform can handle authentication natively. A dedicated service account is assigned to the webserver and granted the roles/datastore.user role, which provides the permissions needed to read from and write to Firestore. The application can then use Google's default credential flow in production, keeping authentication tied to infrastructure policy instead of application configuration.
This reduces secret management overhead and makes deployment simpler. There is a tradeoff here: the role is scoped at the project level, so it is broader than a perfectly least-privileged setup. In this case, that is acceptable because the application runs in its own dedicated GCP project and does not share that project with other databases or workloads.
The result is authentication that is more secure, more maintainable, and easier to operate. Instead of managing a static credential in the app, access is controlled through infrastructure policy, which is easier to reason about and safer to change over time.
Operations#
Monitoring Summary#
Monitoring in this project is focused on useful signals rather than maximum telemetry. The goal is not to enable every Datadog feature available, but to collect the data needed to establish a baseline, catch real problems, and understand how the application behaves in production over time.
That baseline matters just as much as the alerts themselves. Unit and integration tests help verify that the application still behaves the way it was designed to, but monitoring answers a different question: what is the live system actually doing right now, and how does that compare to normal? That makes it possible to spot regressions, resource pressure, unusual traffic patterns, or degraded availability even when no test was written specifically to catch them.
This monitoring setup is admittedly more comprehensive than a small resume site strictly needs, but that is part of the point of the project. The application itself is simple. The operational model around it is meant to demonstrate how a real service can be observed, measured, and maintained in production.
Observability Highlights#
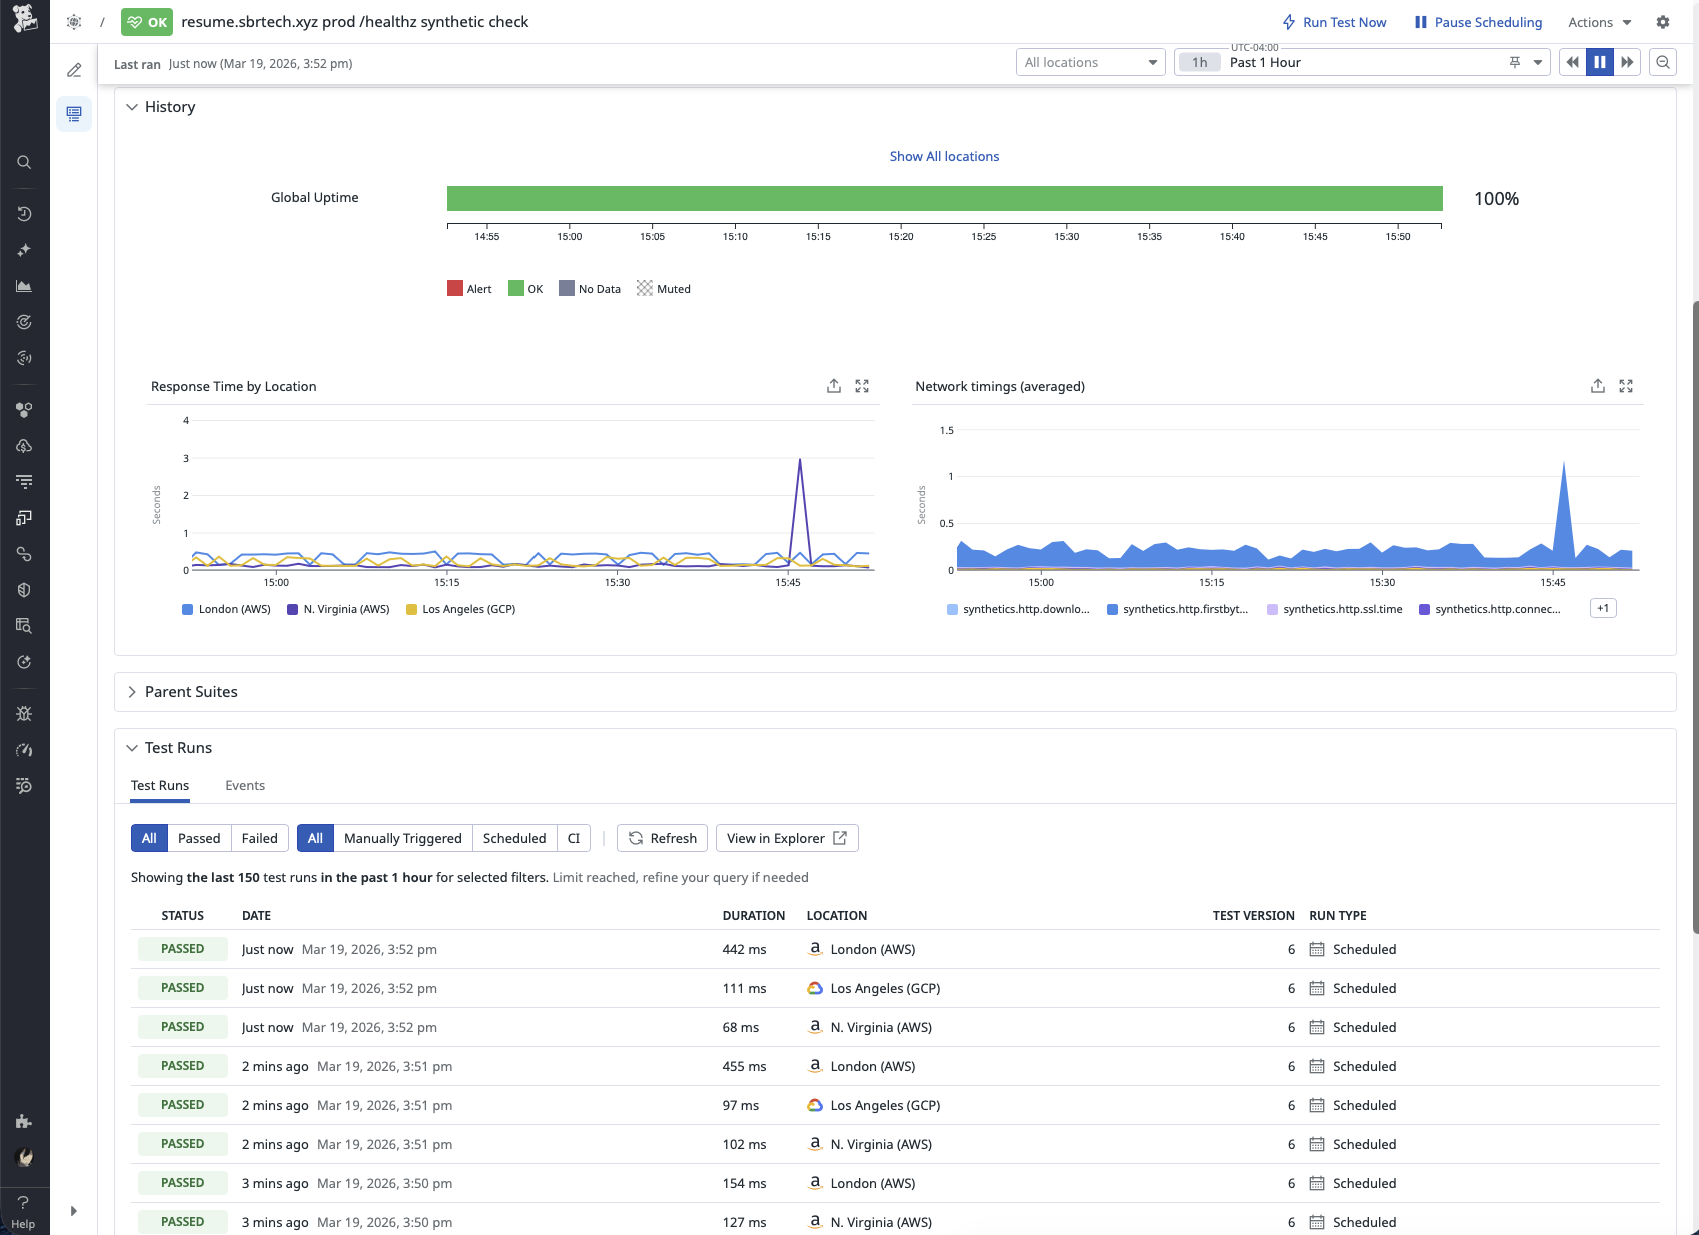
Availability is measured externally using a Datadog Synthetic API test against the /healthz endpoint. That endpoint exists specifically so uptime checks do not affect application state by incrementing the visitor counter. The synthetic check feeds both an availability monitor and a 30-day 99% availability SLO, which provides a simple big-picture view of whether the site is staying reachable over time.
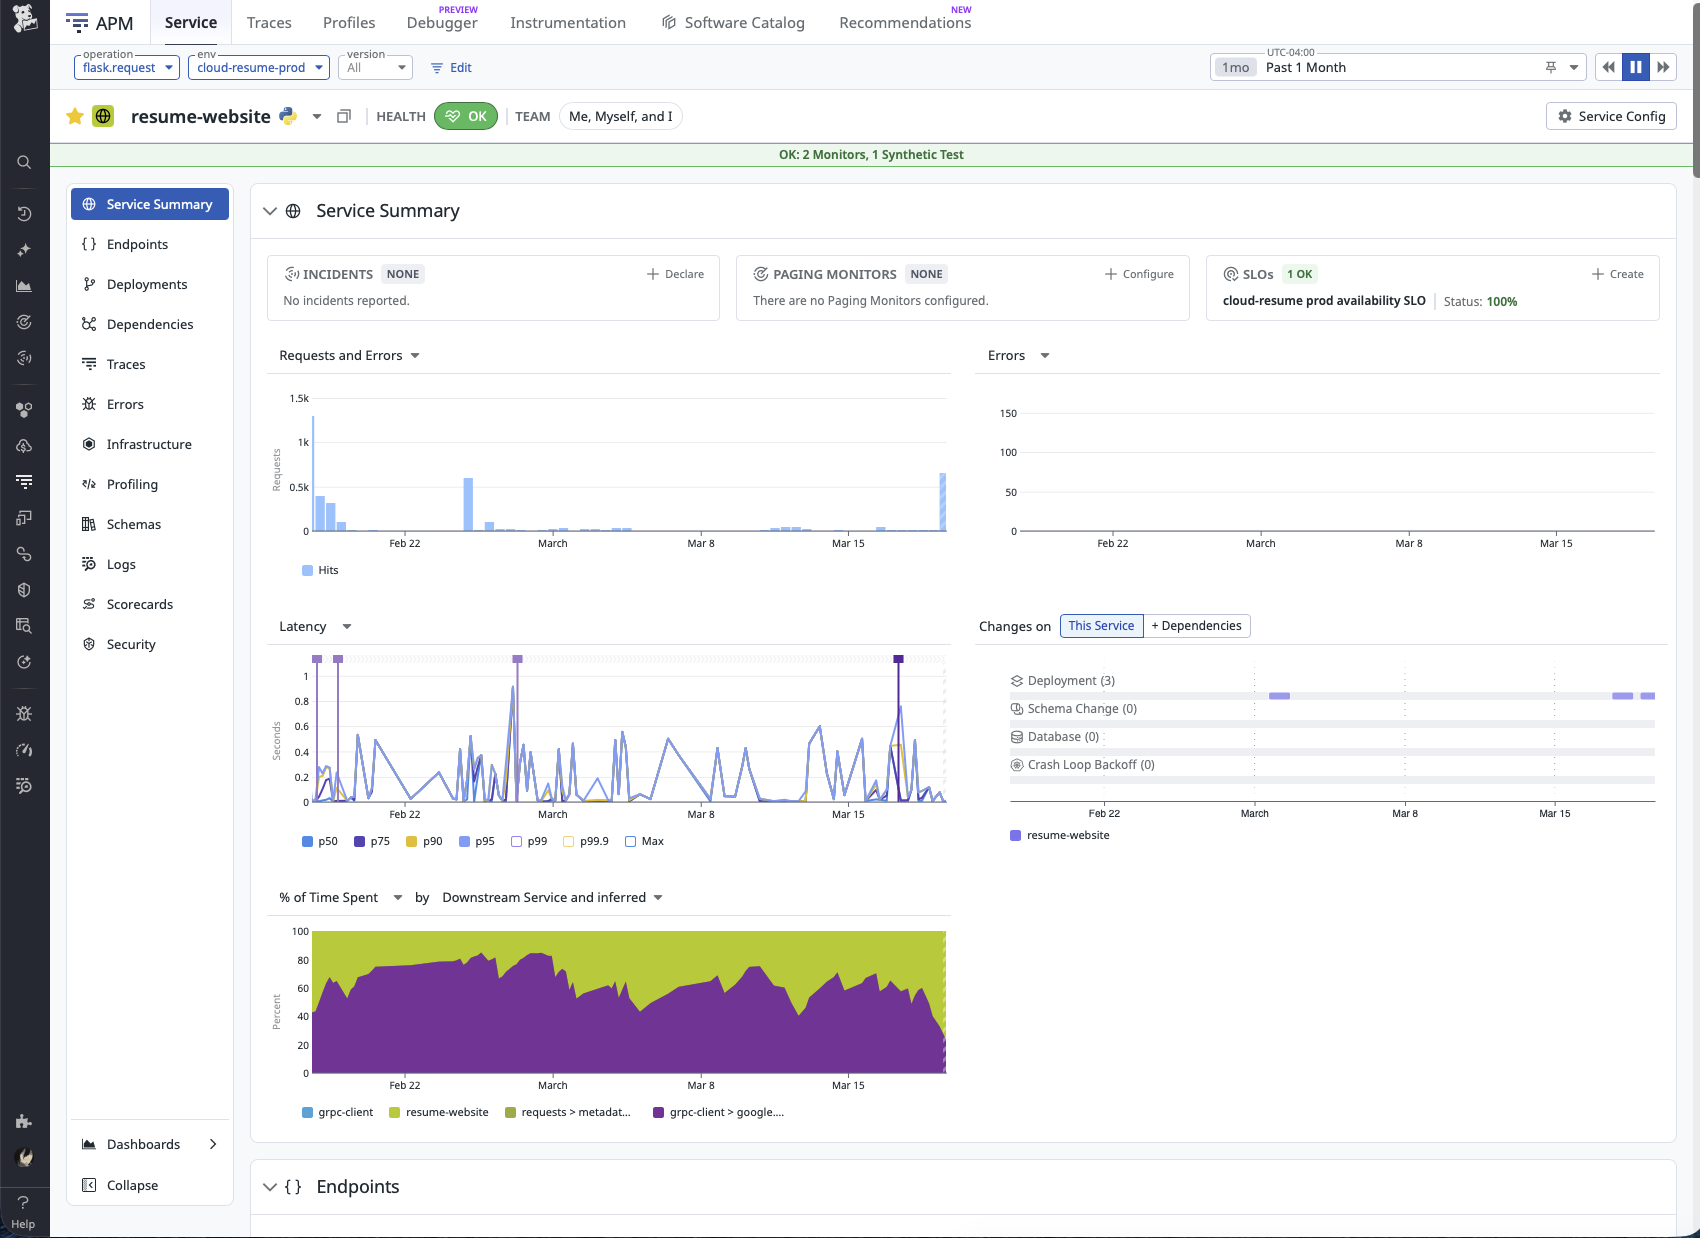
For day-to-day troubleshooting, the most useful parts of the stack are APM and structured application logs. Metrics and monitors are important, but they do not show how the application actually executed a request. APM makes it possible to see what the service did, while logs provide the application’s own account of what happened. Together, they make it much faster to triage behavior that looks wrong in production. That was especially useful while tracking down the visitor counter bug documented in GitHub issue #42, where the telemetry helped narrow the problem down to the part of the code path that actually needed attention.
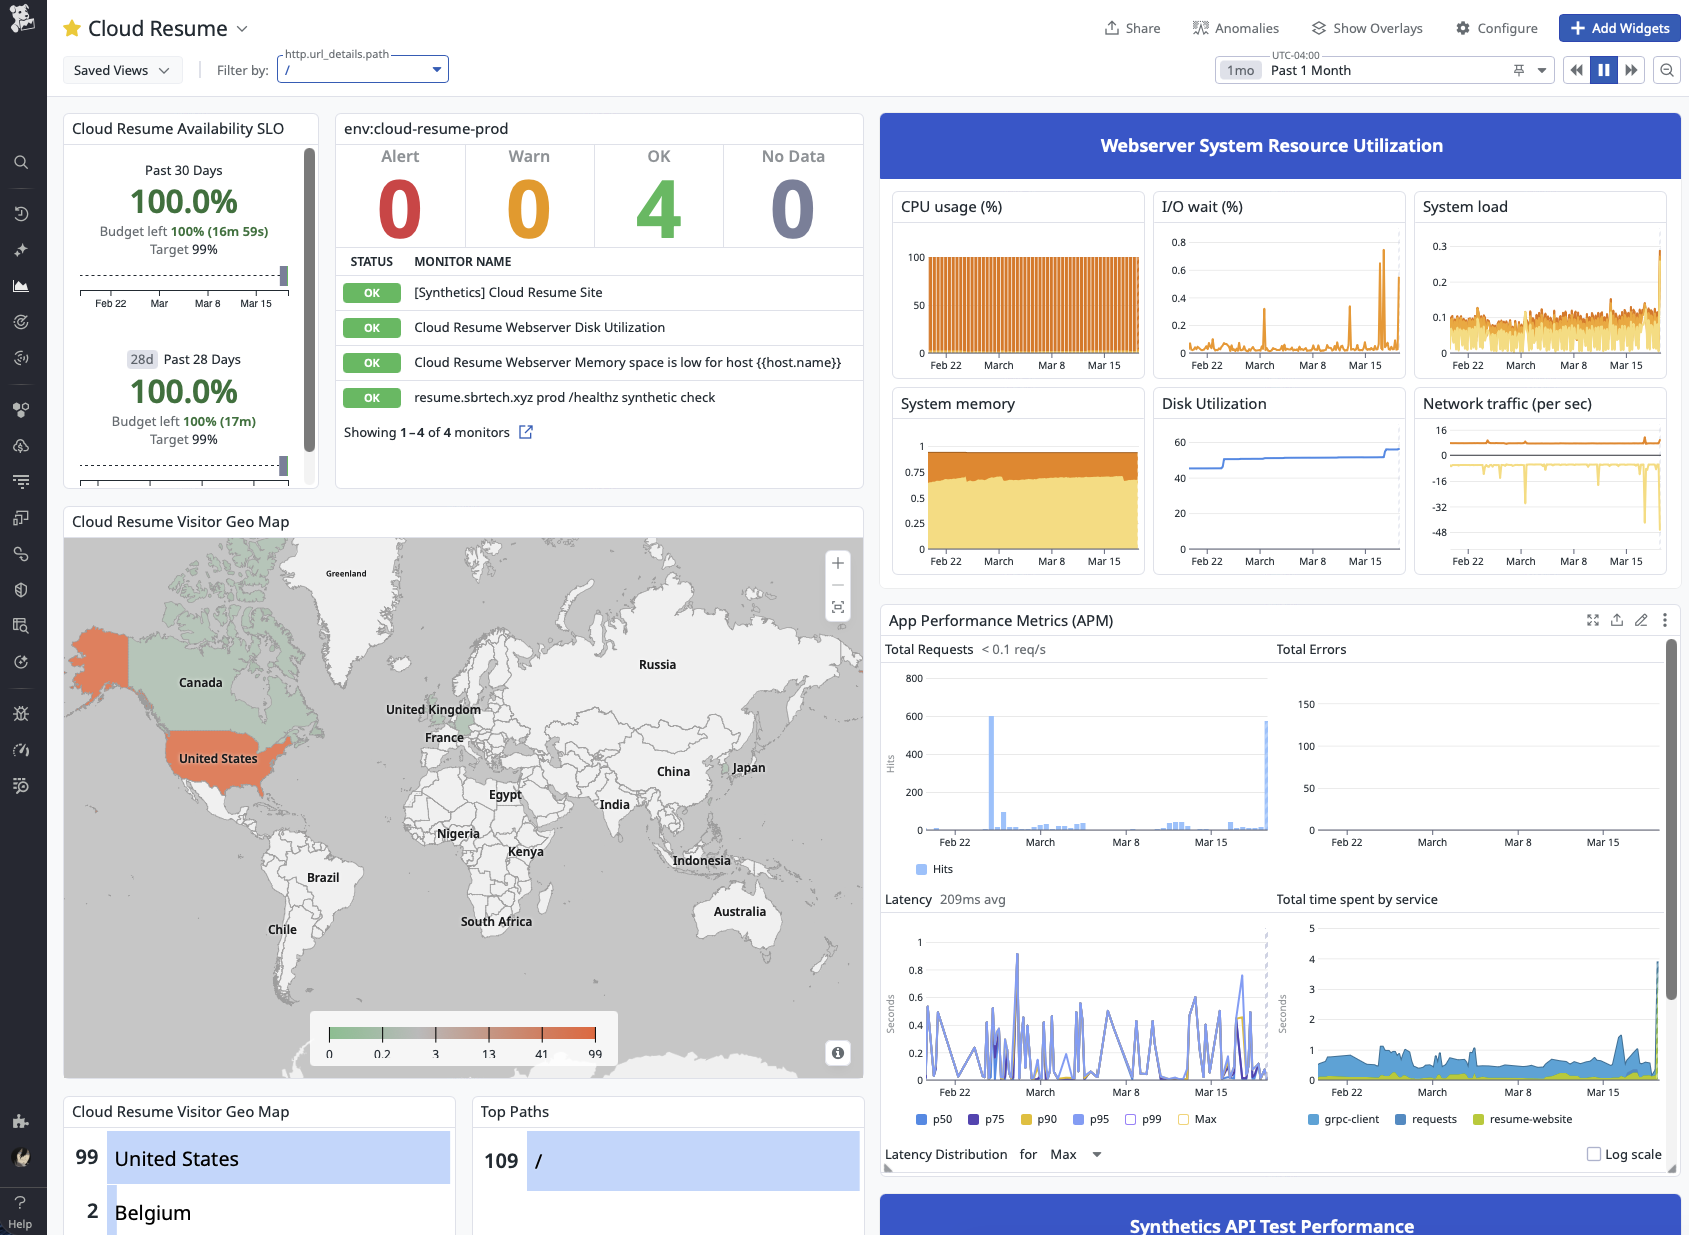
The main operations dashboard is built as a daily-use view of the service. It combines monitor status, SLO health, host resource utilization, APM, logs, traffic patterns, and synthetic performance in one place. Synthetic /healthz traffic is filtered out of the main traffic widgets so the dashboard reflects what real visitors are doing on the site rather than what the uptime probes are doing behind the scenes. That keeps the dashboard focused on the parts of the application customers and stakeholders actually interact with.
Deployment Workflow#
Changes reach production through a repeatable CI/CD workflow rather than a manual checklist.
- Work starts on a feature branch.
- A pull request is opened and merged through the release flow.
- Pushes to
maintrigger GitHub Actions. - Tests run before the production deployment continues.
- A versioned container image is built and published.
- Terraform applies infrastructure changes.
- Ansible configures the host and deploys the updated application.
- Datadog then provides post-deploy visibility into availability, performance, logs, and host health.
This flow is important because testing and observability solve different problems. Tests help catch broken behavior before release. Monitoring then confirms whether the deployed version is actually healthy once it is live.
Automation Summary#
Automation in this project means turning deployment and infrastructure changes into a repeatable process instead of relying on memory and manual steps. GitHub Actions, Terraform, and Ansible handle the release path consistently, while Datadog provides the feedback loop needed to verify that the deployed system is still healthy afterward.
The result is a small application operated with the same mindset used for larger services: changes are tested, deployments are repeatable, production is observable, and the monitoring stack is designed to produce meaningful signal instead of noise.
Lessons Learned#
Intro#
The best part about building something real as an engineer is the lessons that come from solving real problems. While I started this project with a goal of learning more Python, the most valuable things I took away had less to do with programming and more to do with constraints, assumptions, and diagnostics. More specifically, it taught me that constraints are useful until they stop serving the real purpose of the project, and that good diagnostics only matter if they help lead to the right decision.
Problem#
Once all the major pieces of the project started coming together, the real show-stopper finally appeared. The Python application was functional, the instance was deployed, DNS was in place, Datadog was installed, and I was making frequent deploys to fix issues and add features. That was exactly when the GCP instance began experiencing severe bouts of iowait, both during normal operation and during deploys.
When it happened, the effect on the system was immediate. Ansible playbooks would hang indefinitely, SSH responsiveness would degrade or disappear entirely, Datadog would stop reporting metrics, and the site itself would sometimes fail to respond to requests. At that point, the problem was no longer just an annoying performance issue. It had become an operational blocker.
Diagnosis#
At first, I assumed the iowait was being caused by the shared 0.25 vCPU that comes with an e2-micro instance. My immediate thought was that the only real fix would be moving to a larger, more capable instance type. Since one of the original project goals was to stay entirely within the Google Cloud Free Tier, that assumption created a mental roadblock right away. I was not excited about turning a free project into something that might cost $10-$30 a month just in compute, so instead I started trying to optimize my way around the problem.
That led to a few useful clues, but not the real diagnosis. Stopping the Datadog agent before a deploy seemed to improve performance, and at one point I thought I had found the root cause. In hindsight, that was a symptom, not the real issue. The agent was not creating the bottleneck by itself. It was exposing how little headroom the host had once enough work was happening at the same time. I was still looking at system load as the cause, when in reality it was only revealing the underlying problem.
The actual bottleneck was the instance storage type.
The only free disk class included with the GCP free tier is pd-standard, and I had simply assumed it would be good enough for this project. Then I went back and re-read the documentation and found the detail I had somehow glossed over the first time:

Cue intense face-palming.
That was the moment it clicked. pd-standard was HDD-backed, not SSD-backed like I had lazily assumed. Whoops.
Once I connected that to what the host was actually doing, the behavior made a lot more sense. This instance was not just serving a small Flask app. It was also running Docker, Caddy, Datadog, and regular deployment activity. Between metric collection, log ingestion, container activity, package operations, and deployment tasks, there were plenty of opportunities for slow storage to become the real bottleneck. The problem was never that the system needed to be dramatically larger. It was that one critical part of it was much slower than I had realized.
The Fix#
Now that the true root cause had been identified, the fix was dead simple:
boot_disk {
  auto_delete = true
  initialize_params {
    image = data.google_compute_image.ubuntu-22-lts.self_link
    size  = 30
    type  = "pd-balanced" # changed from pd-standard
  }
}
Instead of resizing the entire instance, I changed the boot disk from pd-standard to pd-balanced so the storage layer matched the actual needs of the system. That targeted the real bottleneck directly instead of treating the symptoms.
After the instance was redeployed, the difference was immediate. During the first deploy, Ansible progressed steadily, SSH remained responsive, and the system stayed online the entire time. Once the deployment finished, the website, Datadog, and the host itself all continued operating normally under load.
The Results#
In the days following the storage class change, it became apparent that this was the right approach all along. Deploys finished reliably, SSH stayed responsive, and the Datadog agent continued delivering metrics no matter the system load. Most importantly, the site itself remained online and usable during the exact situations that had previously caused it to fail.
The cherry on top? GCP bills instance compute separately from the attached storage device. The grand total for fixing this show-stopping issue came out to just $3.52 per month, well below the $10-$30 per month I had prepared myself to pay for a larger instance size.
Takeaways#
The biggest lesson here was that constraints are only useful as long as they still serve the real purpose of the project. Staying entirely inside the GCP free tier was a good goal when the project started, but at some point that goal became more important than the reason I was building the project in the first place. Once that happened, it stopped being a useful constraint and started becoming a liability.
This issue also reminded me how expensive assumptions can be. I had already convinced myself the only real fix would be scaling the entire instance and accepting a much higher monthly bill. In reality, the problem was far narrower than that. The actual bottleneck was storage, and once I stopped treating the free tier as untouchable, it became much easier to step back, re-evaluate the evidence, and find the better answer.
More than anything, this reinforced that diagnostics only matter if they change the decision being made. The host metrics, failed deploys, Datadog behavior, and general instability were all useful signals, but the real work was separating the symptom from the cause. In the end, the fix was not bigger infrastructure, more brute force, or some heroic tuning effort. It was simply understanding the system well enough to change the right thing.